About a year ago I contributed a plotting module
to SymPy, which was extended with some nice features thanks to a
GSoC project
just after that. The module supports multiple backends, but for the moment only
matplotlib is implemented. It would have been simpler if we had decided to
support only matplotlib, but that would mean limiting ourselves to producing
math graphics with a tool designed for engineers. Moreover, matplotlib does not
support all modes of presentation that we would like to have (e.g. nice
renderings of surfaces for when we are solving systems of nonlinear equations).
Finally, given its Matlab heritage and dedication to backward compatibility
is rather unattractive in its default settings.
Hence I started playing around with D3.js in IPython. I was told that the
IPython team will work on a canonical way to represent objects through
visualization libraries after the release of version 1.0, but that does not
mean that we can not concort together some “Not The Right Way” solution now.
Moreover it would permit me to show how easy it is to add a new backend to the
SymPy plotting module.
Anyway, if you want to obtain this:
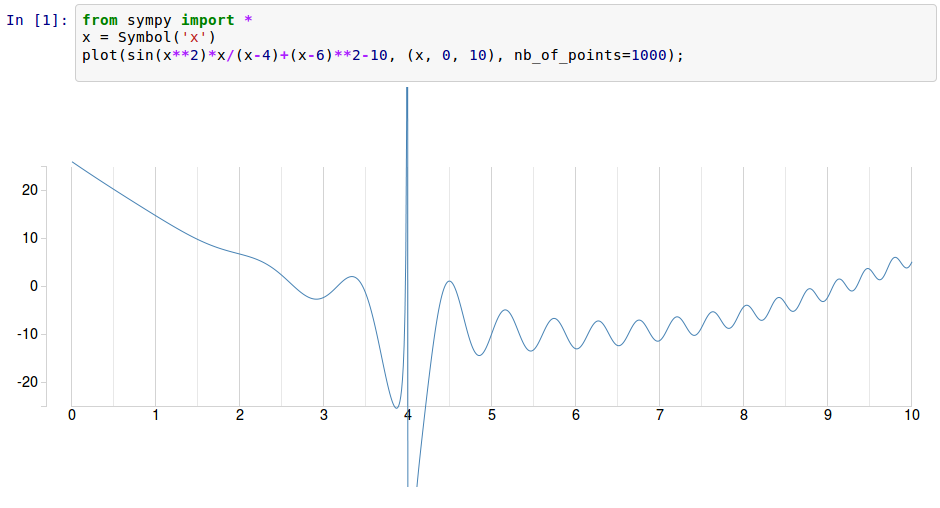
it would be sufficient to make a new backend that uses publish_html and
publish_javascript in its show() method.
Start with
class IPythonD3Backend(BaseBackend):
    def __init__(self, parent):
        super(IPythonD3Backend, self).__init__(parent)
        are_3D = [s.is_3D for s in self.parent._series]
        if any(are_3D):
            raise ValueError('The D3 backend can not do 3D.')
For the moment we will restrict ourselves to single lines, as this is just a prototype:
    def process_series(self):
        parent = self.parent

        for s in self.parent._series:
            # Create the collections
            if s.is_2Dline:
                self.data = "[%s]"%(", ".join("[%s, %s]"%_ for _ in zip(*s.get_points())))
            else:
                raise ValueError('The D3 backend does not support this type of plot.')
and in show we construct the html and javascript code that we want to publish.
    def show(self):
        global _ipython_div_counter
        from IPython.core.display import publish_javascript, publish_html
        self.process_series()
        publish_html("""
        <style>
            /* tell the SVG path to be a thin blue line without any area fill */
            path {
                stroke: steelblue;
                stroke-width: 1;
                fill: none;
            }

            .axis {
              shape-rendering: crispEdges;
            }

            .y.axis .minor, .x.axis .minor {
              stroke-opacity: .5;
            }

            .x.axis line, .x.axis path, .y.axis line, .y.axis path {
              stroke: lightgrey;
            }
        </style>

        <div id="sympy_d3_plot_%d" class="aGraph" style="position:absolute;top:0px;left:0; float:left;"></div
        """%_ipython_div_counter)
        publish_javascript("""
        var script = document.createElement("script");
        script.src = "http://d3js.org/d3.v3.min.js";
        document.body.appendChild(script);

        var m = [80, 80, 80, 80]; // margins
        var w = 1000 - m[1] - m[3]; // width
        var h = 400 - m[0] - m[2]; // height

        var data = %s;

        var x = d3.scale.linear().domain([0, 10]).range([0, w]);
        var y = d3.scale.linear().domain([-25, 25]).range([h, 0]);

        var line = d3.svg.line()
            .x(function(d) {
                return x(d[0]);
            })
            .y(function(d) {
                return y(d[1]);
            })

            var graph = d3.select("#sympy_d3_plot_%d").append("svg:svg")
                  .attr("width", w + m[1] + m[3])
                  .attr("height", h + m[0] + m[2])
                  .append("svg:g")
                  .attr("transform", "translate(" + m[3] + "," + m[0] + ")");

            var xAxis = d3.svg.axis().scale(x).tickSize(-h).tickSubdivide(true);
            graph.append("svg:g")
                  .attr("class", "x axis")
                  .attr("transform", "translate(0," + h + ")")
                  .call(xAxis);

            var yAxisLeft = d3.svg.axis().scale(y).ticks(4).orient("left");
            graph.append("svg:g")
                  .attr("class", "y axis")
                  .attr("transform", "translate(-25,0)")
                  .call(yAxisLeft);

            graph.append("svg:path").attr("d", line(data));
        """ % (self.data, _ipython_div_counter))
        _ipython_div_counter += 1

    def save(self, path):
        pass

    def close(self):
        pass
The only slightly nontrivial part is loading the D3 library, which is done with the following snippet:
        var script = document.createElement("script");
        script.src = "http://d3js.org/d3.v3.min.js";
        document.body.appendChild(script);
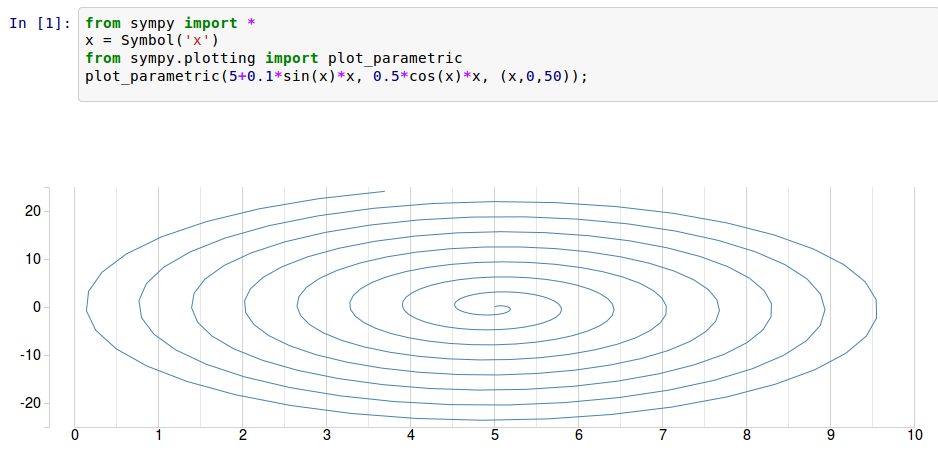
And the nice thing is that this works for all possible line charts (so parametric charts do not need additional treatment):
Obviously much more can be done, but I will probably wait for IPython 1.0 before writing this new backend.